How well do you know your sales pipeline?
If your answer is anything short of, “Like the back of my hand,” your team probably doesn’t close many deals. After all, your pipeline knowledge directly affects your ability to plan field sales strategies, make real-time decisions, and grow revenue.
Thankfully, pipeline reporting will give you all of the information you need to properly coach your reps, boost sales, and achieve more success for your company.
In this article, we’ll explain what sales pipeline reports are, why they’re beneficial to field sales managers like yourself, what your reports should include, and more.
What is a sales pipeline report?
A sales pipeline report will tell you how many deals are in your sales funnel, the stage each deal is in, and the value these deals represent to your company.
These days, most field sales teams use software to generate sales pipeline reports, which is advantageous because most software applications can visualize your sales process, making it easier to analyze, understand, and ultimately, optimize.
Once you have a sales pipeline report in hand, you’ll be able to better identify the holes in your sales process, evaluate rep and team performance, and forecast future results for your sales team. Let’s take a closer look at each of these benefits…
Why is pipeline reporting important for field sales managers?
As mentioned above, pipeline reporting will benefit your field sales department in multiple ways. Here are the most important ones you can look forward to:
Identify what is (and isn’t) working in the sales process
At the end of the day, your team’s sales process determines your level of success. Implement a solid process and deals will get made. Implement a bad one and… Well, let’s just say that your company might have trouble keeping the lights on.
A sales pipeline report will dig deep into the health of your sales process, helping you pinpoint the good, the bad, and the ugly. You can then use this information to eliminate subpar strategies, while doubling down on top performing ones.
For example, you might find that few deals progress beyond the initial stages of your funnel. As such, you might determine your team has a lead quality issue.
Evaluate rep and team performance
Pipeline reporting will also help you keep an eye on your sales reps.
Is each rep meeting your performance standards? If not, which ones are lagging behind? And what do they do differently than your top performers?
If you can identify the tactics, strategies, email scripts, etc. that your best sellers use to move prospects through your sales process, you can coach the rest of your team to do the same. Doing so will help your entire sales team achieve more.
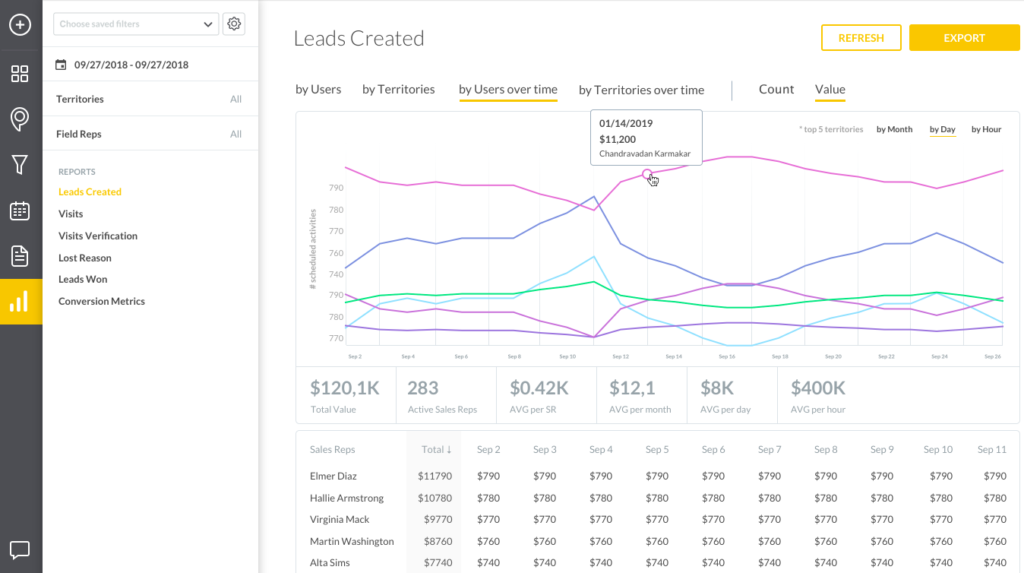
Tools like SPOTIO make it super easy to analyze individual rep performance. For example, you can use our platform to view each rep’s pool of leads, where said leads are in the sales funnel, and how long it will likely take them to close.
Deliver more accurate sales forecasts to execs
Lastly, sales pipeline reports simplify the forecasting process.
This is important because company execs rarely care how sales are made. They just want to see more revenue flowing into your company than flowing out.
Sales forecast reports give them this kind of information. And guess what—sales pipeline reports make it way easier to generate sales forecasts.
What to cover in a sales pipeline report
Sales pipeline reports are obviously beneficial. The question is, what metrics and KPIs should your reports include? Here’s what we recommend:
Total number of leads
What is it? The total number of leads in your company’s sales pipeline. This includes brand new leads, legitimate prospects whom your reps have begun negotiating with, and almost-customers who have been made offers. Basically, if the lead hasn’t signed a contract with your company yet, they should be included.
What does it tell you? The “total number of leads” metric will tell you how healthy your sales pipeline is. It will also shed light on how effective your lead generation strategies are, and whether or not your current sales targets need to be adjusted.
How do you calculate this KPI? It’s pretty simple: just add up the total number of leads in each stage of your sales funnel. Then put that figure in your report.
Total number of opportunities by stage
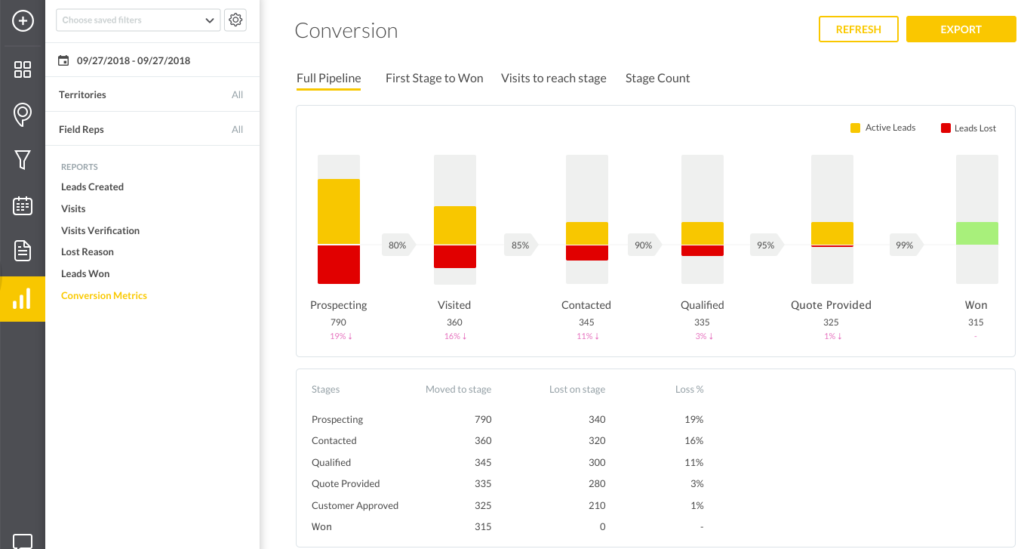
What is it? The total number of opportunities in each stage of your company sales funnel. In a perfect world, each stage will have a similar amount of opportunities and revenue potential. If not, you may have a bottleneck in your sales process.
What does it tell you? The “total number of opportunities by stage” metric will tell you the number of leads your company has in each stage of the buying process. It will also help you pinpoint leaks in your funnel, because you’ll be able to clearly see where potential customers get stuck and drop out of your sales pipeline.
How do you calculate this KPI? Again, this metric is easy to calculate: simply tally up the leads in each stage of your sales pipeline (prospecting, outreach, etc.)
Lead-opportunity conversion rate
What is it? The percentage of leads that convert into opportunities within a specific time frame. To clarify, a lead is an unqualified buyer. An opportunity is a qualified prospect. The difference? Opportunities close way more often than leads.
What does it tell you? The “lead-opportunity conversion rate” metric will tell you how effective your lead generation efforts are. Quality leads turn into prospects at a higher rate. It will also tell you how effective your sales strategy is, and/or how skilled your individual reps are. If your team has a hard time converting leads to opportunities, something inside your sales process is broken and needs to be fixed.
How do you calculate this KPI? Divide the number of leads your sales team has successfully converted into opportunities by the total number of leads your team has generated. Then multiply the resulting figure by 100.
Pipeline value by stage
What is it? The monetary value of leads in each stage of your company’s sales funnel. Remember, pipeline value is hypothetical. Your field sales team has to actually close deals to realize the potential that this KPI represents.
What does it tell you? The “pipeline value by stage” metric will tell you how much money you could make if you close every deal in each stage of your sales funnel.
How do you calculate this KPI? Pick a funnel stage, such as “meetings booked.” Then add up the revenue your sales team will generate if it closes every deal in it.
Pipeline coverage per rep
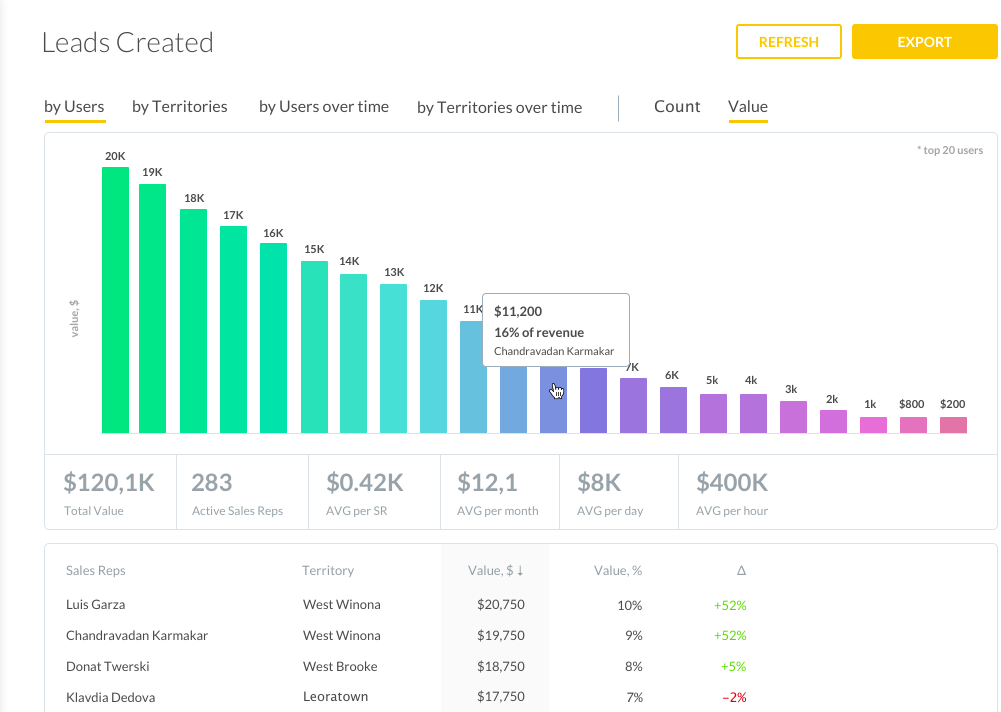
What is it? Each individual rep’s pipeline value, as compared to their target revenue. For example, if a rep hopes to close $100,000 of new business in a month, and their own pipeline opportunities add up to $100,000, they have 1x coverage.
What does it tell you? The “pipeline coverage per rep” metric will tell you which of your sales reps will miss, hit, or exceed their sales quotas.
How do you calculate this KPI? Add up each rep’s individual pipeline value. Then compare it to the sales quota you’ve set for them.
Average sales cycle per rep
What is it? The average amount of time it takes one of your sales reps to move a lead through your sales pipeline, from initial contact to closed deal.
What does it tell you? The “average sales cycle per rep” metric will tell you how long it usually takes your reps to make sales. When you have this information, you can better coach your sales team. You can, for instance, look at what top performing reps, i.e. reps with shorter sales cycles, do to close faster; then share these secrets with low-performing reps, i.e. reps with longer sales cycles. You can also help reps pinpoint stagnate deals, then provide next steps.
How do you calculate this KPI? Divide the amount of time you’re viewing by the number of deals closed within that time frame for each of the reps on your team. For example, if Rep A closes 30 deals in 90 days, his average sales cycle is 3 days.
Close rate
What is it? The percentage of prospects that your sales team successfully converts into paying customers. This KPI is sometimes referred to as “win rate”.
What does it tell you? The “close rate” metric can tell you a lot of things, such as how effective your sales strategy is, how skilled your sales reps are, whether your sales team is performing above or below industry standards, and how much revenue you can expect to generate for your company in the coming months.
How do you calculate this KPI? Divide the total number of deals your sales team has closed within a specific time frame by the total number of prospects in your sales pipeline during that time frame. Then multiply the resulting figure by 100.
Pipeline velocity
What is it? The speed at which your team’s prospects move through your sales pipeline, expressed as a dollar amount, such as $7,500.
What does it tell you? The “pipeline velocity” metric will tell you how much potential money flows through your sales pipeline on a daily basis, as well as the success of your current sales strategy. If you notice a significant change in your pipeline velocity, good or bad, you need to investigate. That way you can help your sales team change or double down on specific tactics as needed.
How do you calculate this KPI? Multiply the number of opportunities in your sales pipeline by the dollar figure these opportunities represent and your team’s average close rate. Then divide the result by your team’s average sales cycle length.
Let’s pretend that you have 100 opportunities in your sales pipeline, which represent $100,000 in potential revenue. Furthermore, your team’s close rate is 35% and it takes an average of 60 days to make a sale. Your pipeline velocity is 58,333.33 in deals a day because (100 deals) x ($100,000) x 0.35 / 60 = 58,333.33.
Sales pipeline reporting best practices
Knowing which metrics to include in your sales pipeline reports is one thing. Creating useful reports that you and others actually want to study is another.
To make your pipeline reports as effective as possible use these best practices:
Keep your audience in mind
Who are you creating a sales pipeline report for?
The pipeline reports you generate for company executives will look different than the ones you generate for yourself and/or the rest of your sales department.
So, before you start adding random metrics and KPIs to your next report, think about your target audience. Then only add relevant data points.
For example, if you want to assess individual rep performance, you might run a pipeline report that includes “lead-opportunity conversion rate” and “pipeline coverage per rep” metrics. But if you need to update company leaders on team goals, you might include KPIs like “total number of leads” and “pipeline value.”
Use visuals
Every pipeline report you generate will include important numbers and data points. The thing is, numbers and data points by themselves are often hard to understand—especially for people who aren’t saturated in them every day.
Visual elements—think bar graphs and pie charts—make dense data more digestible. As such, visuals will make your reports more relatable and user-friendly.
Review pipeline reports regularly
Pipeline reporting isn’t something you do once a year—or even once a quarter.
It needs to happen more frequently than that. Why? Because regular pipeline reports will help you keep your sales team on track and achieving its goals.
Once you make pipeline reporting a habit, you’ll have greater control over your sales process, which you can adjust as needed to help your team close more deals.
Keep your pipeline reports clean
Pipeline reports should make your job as a field sales manager easier. To ensure this is the case, keep your reports clean, i.e. free of extraneous information.
How do you do this? It’s pretty simple: only include the metrics and KPIs that you need in each of your reports. This is another reason why knowing your audience (see above) is critical to effective sales pipeline reporting.
Act on the insights
We’ll be honest with you, sales pipeline reports are useless if you don’t actually use the information they help you uncover. Don’t make this mistake!
Run reports on a regular basis. Study the reports you generate. Then act on the insights your reports give you so that you can lead your sales team effectively.
Simplify pipeline reporting with SPOTIO
Pipeline reporting is essential to the success of your field sales team.
Once you commit to and master this practice, you’ll be able to properly evaluate your sales process, assess each of your reps’ individual performance, and deliver more accurate sales forecasts to your company’s executive team.
Of course, mastering the art of pipeline reporting is a lot easier with tools like SPOTIO. Our platform was specifically designed for field sales teams and will help you generate data-drive, visual, and highly actionable reports. Sign up for a free demo of SPOTIO today to see it in action and decide if it’s right for your team.