Designing an Effective Biopharma Payout Curve – Part 2: Best Shape for Different Compensation Designs
May 9, 2022
Designing the right payout curve for a biopharma sales force is critical to driving sales force motivation and overall sales. This element of sales compensation planning is so important and multifaceted that we are dedicating a three-part series to payout curve design, the first of which outlined the six core payout curve shapes: linear, convex, concave, s-shape, reverse s-shape and step. This second part will explore the strengths and weaknesses of these shapes as well as when they should and should not be used for different types of sales compensation plan designs, namely goal attainment and rank order.
Which Design Types Use Payout Curves?
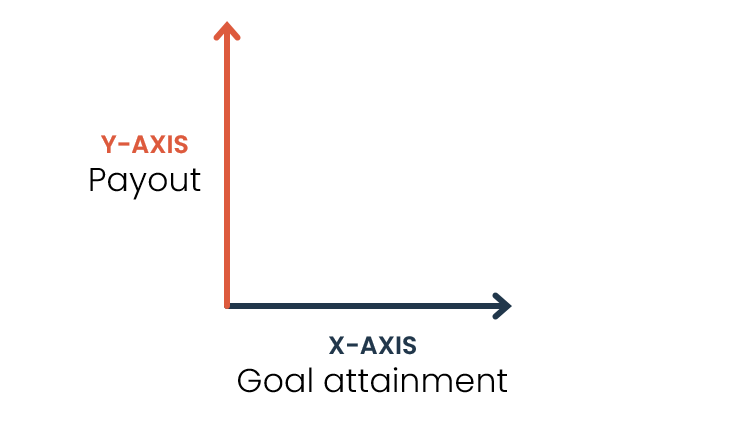
When most people think of payout curves, they think of goal-based plans where the y-axis is payout and the x-axis is goal attainment, as shown in the figure below. However, payout curves are also used to set payouts for rank order plans—the y-axis is payout and the x-axis is rank, also shown in the figure below.
Whether the x-axis is goal attainment or whether it is rank has significant implications for which payout curve shape would work best. Let’s first explore this question for a rank order plan.
What’s the Best Payout Curve for Rank Order Plans?
Rank order sales compensation plans are typically never as effective or motivating as goal-based, commission-based or grid-based plans. Nevertheless, if a rank order plan is to be used, the two most common payout curve shapes adopted are the step curve and reverse s-shape curve. Between these two shapes, the reverse s-shape curve is the superior option.

As discussed in part 1 of this series, step curves are non-continuous, meaning that payout is the same for groups of performance, or, in this case, groups of ranks. A rank order step payout curve might award the top 10% of ranks the same bonus, the next 15% of ranks the same bonus, and so on. Thus, an increase in rank does not necessarily translate to an increase in earnings. As a result, depending on where a representative falls in a step or how wide the step is, the representative has little incentive to keep selling because improving performance would likely not increase payout. Consequently, step payout curves, whether for rank or goal attainment, are not motivating.

If a rank order plan must be used, then the reverse s-shape curve is the best option. This is because the reverse s-shape curve is the least steep around the middle ranks and is the steepest around the very high and very low ranks. One of the critical tests of equity of our SCOR³ES® diagnostic assessment is the pay-for-performance test of equity: those who achieve similar performances should be paid similar bonuses while those who achieve very different performances should be paid bonuses that reflect that difference. Under most sales compensation plans, performances tend to follow a bell-shaped curve—most sales representatives achieve performances around the average performance level, a small amount perform below average, and a small amount perform above average.
Thus, the flatness of the reverse s-shape curve around the middle ranks means that a small change in performance that results in a large change in rank (since representatives are so tightly clustered in the middle) results in a small change in bonus (i.e., a small increase in performance translates to small increase in bonus). Similarly, the steepness of the curve around the very high and very low ranks (where it takes much more to change rank) means that a large change in performance that results in a small change in rank (since there are so few representatives at these extremes) results in a large change in bonus (i.e., a large increase in performance translates to large increase in bonus).
What’s the Best Payout Curve for Goal-Based Plans?
Biopharma companies use a number of different payout curves for goal-based sales compensation plans. In the below sections, we explore which curves are recommended for which circumstances.

Concave and reverse s-shape curves are recommended only for the post-launch stage of the product life cycle. This is because these curves get the sales force into the money quickly in order to keep them engaged when sales might still be very difficult to achieve. Note, however, that the reverse s-shape curve must slow down at higher attainment levels; not only will this ensure fiscal responsibility of the plan, but it will also prevent the dissonance that tends to occur when certain members of the sales force earn bonuses that are so much higher than the rest of the sales force.


Beyond the post-launch stage, the best curves to use are an s-shape curve or a linear curve with a slowdown as these shapes tend not to overpay for low performance and are fiscally responsible.

The convex and step curves should never be used for a goal-based plan. In fact, no step of any kind should be used in a goal-based plan. Some companies put a step at 100% attainment in an effort to push representatives to reach goal; however, as explored earlier with rank order curves, this does not pay for performance and, given how difficult it is to set accurate goals, penalizes the representative for the difficulty of setting accurate goals. Most goal setting error terms are greater than 1%, so if a sales representative comes in at 99% attainment and consequently is just short of reaching a step at 100% attainment, then this demotivating lack of bonus likely has more to do with goal setting accuracy than the representative’s lack of achievement.
Conclusion
The right payout curve shape to use in a biopharma sales compensation plan depends on a number of conditions, from design type to life cycle stage. Shapes that are effective for one design type or one life cycle stage are often detrimental to another, making it critical to know when to use each type of curve. Now that we’ve explored the core payout curves as well as when each should and should not be used, the third and final part of this series will explore how to determine where the threshold of your payout curve should be as well as how steep your curve should be.