Medical Infographic Design Best Practices
Infographics serve as powerful tools in simplifying complex medical information, making it accessible and understandable to a broad audience. Defined as visual representations of data or knowledge, infographics amalgamate text, images, and graphics to convey information concisely and effectively. In the realm of medical communication, their significance cannot be overstated. Whether it’s illustrating the intricacies of a medical procedure, breaking down the statistics of a health issue, or explaining the mechanisms of a disease, infographics play a pivotal role in bridging the gap between medical professionals and patients, as well as educating the broader public. In this blog, we delve into the best practices of medical infographic design, aiming to equip healthcare professionals, educators, and communicators with the tools and knowledge necessary to create compelling and informative visuals that resonate with their audience. Through exploration of design principles, case studies, and emerging trends, we seek to empower readers to harness the full potential of infographics in conveying medical information accurately and engagingly.
Understanding the Audience
In the medical field, effective communication hinges on understanding your audience. This initial step involves identifying the target recipient of your message, whether it’s a patient, a fellow healthcare professional, or the general public. Once you’ve pinpointed your audience, analyzing their needs and preferences is crucial. What level of medical knowledge do they possess? Are there specific anxieties or concerns they might have? Tailoring your language and approach to address these factors fosters better comprehension and engagement.
Key Elements of Effective Medical Infographic Design
Crafting a successful medical infographic requires a delicate balance between scientific accuracy and clear communication. Here, several key elements come into play:
A. Simplicity and Clarity:
- Importance of clear messaging: The core message of your infographic should be evident at first glance. Avoid jargon and technical language, opting for concise explanations that resonate with your target audience.
- Avoiding clutter: Resist the urge to cram too much information into a single infographic. Prioritize key points and present them in a visually uncluttered way.
B. Visual Hierarchy:
- Organizing information for easy comprehension: Structure your infographic in a logical flow, guiding the viewer’s eye through the information hierarchy. This could involve using a clear layout, directional cues, and progressive visual elements.
- Using hierarchy to guide the viewer’s eye: Employ visual elements of varying size, weight, and colour to emphasize key points or stages in a process. This creates a natural reading path for viewers.
C. Use of Appropriate Visuals:
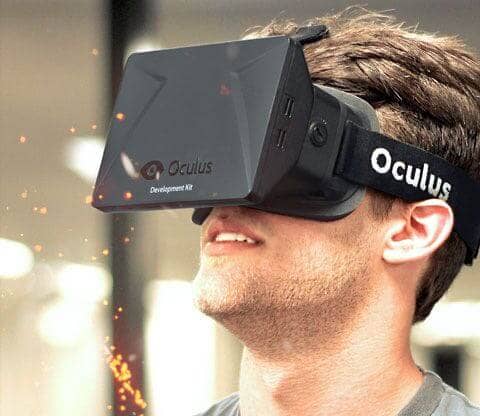
- Utilizing advanced visuals for deeper engagement: Using 3D animation and virtual reality (VR) to represent complex medical processes or anatomical structures offers numerous benefits over static images.
Using 3D animation and VR to showcase anatomical structures or typical medical processes provides several advantages. These mediums offer immersive experiences, enabling users to interact with the content effortlessly. This interaction enables users to explore the subject matter from several perspectives and understand the comprehension of complex concepts.
For example, Infusion Medical’s InfuseVR allows physicians to upload their MRI and CT scans quickly and then immediately examine those scans through an interactive and immersive VR environment. In this way, physicians can slice through layers of the scan to isolate different regions in it, all in a thorough 3D format.
Moreover, 3D animation and VR can simulate spatial relationships and dynamic processes more effectively than static images. This dynamic representation helps in visualizing physiological processes, such as cellular interactions or blood flow, in a way that static images cannot. In this way, users can understand how multiple components interact within the body.
3D medical animation can accurately demonstrate surgeries, disease processes, drug mechanisms, and cellular interactions. Additionally, these visuals play a vital role in patient education by describing the impacts of medical interventions, treatment options, and potential outcomes.
For example, Infusion Medical’s Spinal Fusion eLearning Course is an eLearning training course built for a medical device manufacturer. The course describes the procedure of pedicle screw placement in spinal fusion surgery for medical practitioners and sales reps. The main focus of the course was to illustrate the process as a preparatory tool. With high-end advanced AR integration and 3D animation, Infusion made an eLearning product that can act both as a preoperative planning tool and a sales tool.
- Here are some key advantages:
1. Enhanced Visualization: 3D animation and VR provide a more immersive and interactive experience compared to static images. Users can explore anatomical structures from various angles and perspectives, gaining a deeper understanding of their spatial relationships and functionalities.
2. Realistic Representation: By simulating real-world environments and physiological processes, 3D animation and VR create a more lifelike portrayal of medical scenarios. This realism helps users grasp complex concepts more intuitively, as they can see how different components interact in a dynamic environment.
3. Engagement and Interactivity: Interactivity is a crucial aspect of 3D animation and VR experiences. Users can actively engage with the content, manipulating objects or navigating through virtual spaces. This hands-on approach promotes active learning and keeps users engaged for longer periods, leading to better knowledge retention.
4. Depth of Information: Unlike static images, which provide limited information from a single perspective, 3D animation and VR allow users to delve deeper into complex topics. Users can zoom in on specific structures, peel away layers, or simulate physiological processes in real-time, gaining a comprehensive understanding of the subject matter.
5. Multi-sensory Learning: VR, in particular, engages multiple senses simultaneously, including sight, sound, and sometimes touch. This multi-sensory approach enhances the learning experience by appealing to different learning styles and reinforcing memory retention.
6. Personalized Learning: With 3D animation and VR, users can customize their learning experience based on their preferences and knowledge levels. They can explore content at their own pace, focus on areas of interest, and revisit challenging concepts as needed, leading to a more personalized and effective learning journey.
- Selecting relevant images, icons, and charts: Carefully choose visuals that directly relate to your medical topic. Icons and illustrations should be simple, culturally sensitive, and universally understood.
- Ensuring accuracy and authenticity of visuals: Since you’re dealing with medical information, accuracy is paramount. Use high-quality sources for images and ensure they represent the information truthfully.
D. Incorporating Data Visualization:
- Presenting medical data effectively: Medical data can be robust, but it can also be overwhelming. Employ clear and well-labelled charts and graphs to present complex information in a digestible way.
- Choosing the correct type of charts and graphs: Select the data visualization format that best suits your data type. For instance, bar charts work well for comparisons, while line graphs can demonstrate trends over time.
Design Principles for Medical Infographics
Beyond the core elements of effective design graphics, medical infographics benefit from a focus on specific design principles:
A. Color Scheme and Typography:
- Choosing colours that convey meaning and evoke emotions: Colors can play a significant role in medical infographics. Opt for colour palettes that are universally understood and promote a sense of trust and clarity. For instance, green might suggest health or growth, while red might highlight warnings or dangers.
- Selecting appropriate fonts for readability: Ensure your infographic utilizes fonts that are clear, professional, and easy to read at various sizes. Avoid overly decorative or script-like fonts that might hinder comprehension.
B. Consistency and Branding:
- Maintaining consistency in design elements: Establish a consistent visual language throughout your infographic. This might involve using a limited colour palette, consistent font styles, and recurring design elements to create a sense of unity and professionalism.
- Incorporating branding elements subtly: If your infographic is part of a more extensive campaign or represents a specific organization, incorporate branding elements subtly. This could involve using a brand colour as an accent or including a small logo. The focus should remain on the informational content, with branding serving as a gentle reminder of the source.
Accessibility and Inclusivity
In the realm of medical communication, ensuring accessibility and inclusivity is paramount. This translates to several key considerations:
- Ensuring accessibility for all users, including those with disabilities: Medical infographics should be designed with accessibility in mind. This includes using alt text for images, employing good colour contrast, and providing clear and concise text. Additionally, screen reader compatibility and keyboard navigation should be considered for an optimal user experience for viewers with visual or mobility impairments.
- Addressing language and cultural considerations: Be mindful of the language used in your infographic. If targeting a global audience, consider multilingual versions. Additionally, avoid cultural biases or assumptions in visuals or text. Ensure icons and illustrations are universally understood and represent diverse populations.
- Providing alternative formats for different needs: Some users prefer a text-based version of your infographic. Offering alternative formats caters to diverse learning styles and accessibility needs. This could include downloadable PDFs in larger fonts or transcripts in different languages.
Tools and Resources for Creating Medical Infographics
Equipping yourself with the right tools and resources is crucial for crafting impactful medical infographics. Here’s a breakdown to get you started:
A. Advanced Visualization Tools
The realm of medical education is undergoing a transformation, driven by the emergence of Advanced Visualization Tools (AVTs). These tools encompass specialized software designed for creating 3D medical animations and VR experiences, fostering a new era of immersive and interactive learning.
While software like Autodesk Maya and 3ds Max are widely used in animation and game development, their capabilities extend to the medical field as well. These industry-standard programs offer a robust feature set that caters specifically to the needs of medical visualization:
- High-Fidelity 3D Modeling: AVTs allow for the creation of incredibly detailed and anatomically accurate 3D models of organs, tissues, and even entire body systems. Software like Maya and 3ds Max provide advanced sculpting, texturing, and rigging tools, enabling the creation of realistic and dynamic models that behave according to their real-world counterparts.
- Medical-Specific Libraries: Many AVTs come equipped with pre-built libraries of medical assets, including bones, muscles, organs, and even disease states.exclamation These libraries save creators time and ensure the accuracy of the depicted structures.
- Advanced Animation Techniques: From simulating complex surgical procedures to depicting cellular processes, AVTs empower creators with a vast array of animation techniques. Motion capture technology can be integrated for even greater realism, allowing for the animation of surgeries or other medical procedures with precise accuracy.
- VR Integration: Several AVTs offer seamless integration with VR platforms, allowing creators to translate their 3D models into immersive virtual experiences. This opens doors for learners to virtually “step inside” the human body, gaining a deeper understanding of spatial relationships and anatomical structures.expand_more
The benefits of these advanced tools extend beyond medical education.expand_more Physicians can leverage them to plan complex surgeries by visualizing the patient’s anatomy in a 3D environment.expand_more This allows for more precise planning and potentially reduces risks during the actual procedure.
In conclusion, Advanced Visualization Tools represent a paradigm shift in medical communication and education.exclamation By harnessing the power of 3D animation and VR, these tools offer a dynamic and interactive learning experience, fostering improved understanding, knowledge retention, and ultimately, better patient care.
B. Overview of popular infographic design tools:
A variety of online and offline infographic design tools cater to different skill levels and budgets. Popular options include user-friendly platforms like Canva and Piktochart, which offer templates and drag-and-drop functionalities. For more advanced users, vector graphics software like Adobe Illustrator provides greater design customization.
C. Resources for medical-related visuals and data:
Finding accurate and reliable visuals is essential for medical infographics. Look for resources like medical stock photo websites, public health databases, and government health agency websites. Consider collaborating with medical illustrators for custom creations that perfectly match your needs.
D. Tips for choosing the right tools and resources:
The best tools and resources depend on your design experience, budget, and the complexity of your infographic. Start by evaluating your skill set and the desired level of customization. Many online platforms offer free trials, allowing you to explore their features before committing. Prioritize accuracy when selecting visuals and data, ensuring they come from reputable sources. Remember, the goal is to create an infographic that is not only visually appealing but also scientifically sound.
Tips for Distribution and Promotion
Once your medical infographic is polished and ready to share, maximizing its reach becomes crucial. Here are some effective distribution and promotion strategies:
A. Strategies for sharing infographics on social media:
Social media platforms offer a powerful avenue for disseminating your infographic. Tailor posts to each platform, utilizing relevant hashtags and compelling captions that entice viewers to click and learn more. Consider creating bite-sized social media content that highlights key points from the infographic, driving traffic to the full version.
B. Leveraging email newsletters and websites for distribution:
If you have an email list or website, these can be fantastic channels for promoting your infographic. Embed the infographic directly onto your website or include a call to action within your newsletter, encouraging subscribers to download or share it.
C. Collaborating with influencers or other platforms:
Partnering with relevant influencers or health-focused platforms can significantly amplify your reach. Identify influencers who resonate with your target audience and explore co-promotion opportunities. Consider guest blogging on relevant websites or offering your infographic as a resource for other platforms that cater to your target audience.
Future Trends in Medical Infographic Design
The landscape of medical infographic design is constantly evolving, driven by advancements in technology and a growing emphasis on patient engagement. Here’s a glimpse into what the future might hold:
- Predictions for the evolution of infographic design in the medical field: Infographics are likely to become even more interactive, allowing users to explore data in real time and personalize their experience based on their needs. Imagine infographics that adapt to a user’s specific health condition or medical history, providing targeted information in a visually engaging way.
- Emerging technologies and their impact on medical communication: Augmented reality (AR) and virtual reality (VR) have the potential to revolutionize medical communication. AR could be used to overlay medical information directly onto a patient’s body, while VR could create immersive simulations for patient education or healthcare professional training. Additionally, artificial intelligence (AI) might play a role in generating personalized infographics or dynamically updating data visualizations based on real-time health information.
These advancements hold the promise of transforming medical infographics from static images into powerful interactive tools that empower patients, enhance communication, and ultimately lead to better health outcomes.
Case Study: Interactive Surgery Simulator | Medical Device Simulation
Client’s goal
The goal was to illustrate how the products incorporate into established procedures and treatments and to bring the simulation into all sales situations.
Challenges addressed
Leveraging 3D animation and augmented reality, learners interactively move surgical tools from a virtual tray to a sterile area. Creating slick animated effects that are more interactive to illustrate the practical application of each device or tool, aiding in understanding the procedure.
Final outcome
The simulation we delivered as an iPad app helped the client’s sales team to integrate the simulation into all sales situations easily. The project illustrates several things we do well: 3D animation, simulation, interactive learning, and virtual reality.
Conclusion
In conclusion, crafting effective medical infographics hinges on understanding your audience, prioritizing clear communication, and utilizing design graphics principles that enhance accessibility and engagement. By leveraging the power of visuals and data visualization, you can transform complex medical information into a compelling and informative format. The future of medical infographic design is bright, with advancements in technology promising even more interactive and personalized experiences. As you embark on creating your medical infographics, remember that the ultimate goal is to empower patients, foster better health outcomes, and contribute to a more informed healthcare landscape. For further exploration, consider delving deeper into the resources mentioned throughout this guide. There’s a wealth of information available to equip you with the knowledge and tools to create impactful medical infographics that make a difference.
Are you ready to enhance your medical information?
Contact Infuse Medical for expert 3D animation and VR solutions. Transform complexity into interactivity and engagement!

