
What sales activities should you report on a daily, weekly, or monthly basis? Here’s what the experts recommend.
Achieving consistent sales growth for your organization is critical to long-term success. However, it can be challenging to achieve when you don’t have the right data and insights to make informed decisions about outside sales teams.
By tracking the right metrics, you can take the necessary steps to grow your revenue and profits. You could do that with sales reports. But not all metrics are created equal.
So we reached out to 40+ experts to identify the top metrics sales managers should be monitoring on a daily, weekly, and monthly basis. We extracted the most popular recommendations, which we’ll dive into below.
Daily Sales Activity Reports
Weekly Sales Activity Reports
Monthly Sales Activity Reports
Expert Responses
Daily Sales Reports
Daily sales rep reports tell us how much effort sales reps are putting in each day to fill the top of the pipeline. Typically, these metrics will be activity-based.
For example: Number of calls made or emails sent (because we can’t get meetings without making contacts).
Here’s a quick breakdown of the metrics to monitor on a day-to-day basis.
Number of Prospects
Outside sales reps should be working hard each day to hit a specific number of new sales prospects. These people meet your ideal customer profile and should be contacted across relevant channels with the end goal of converting them into leads.
Field sales reps use SPOTIO’s Lead Machine to quickly search for new prospects using 200+ different data points such as income level, business type, and credit capacity.
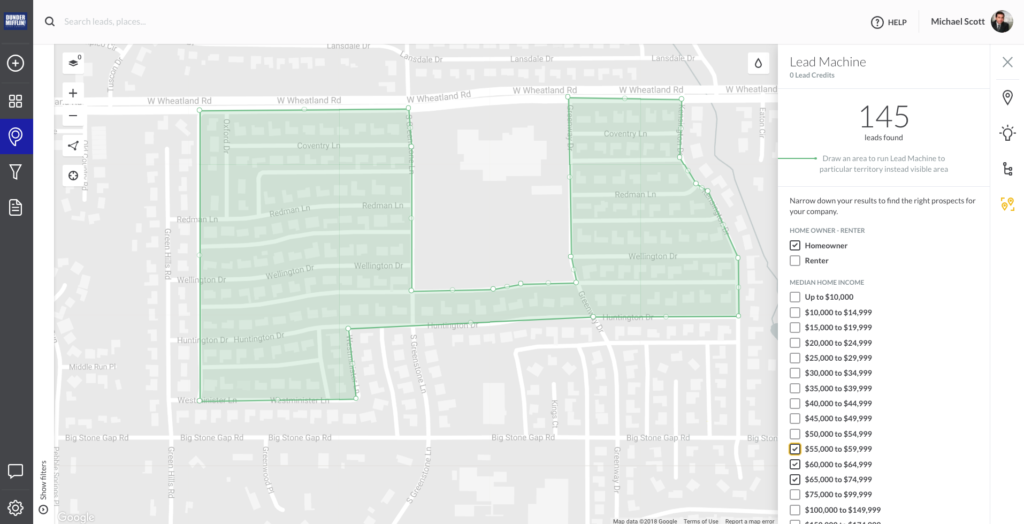
Image: SPOTIO Lead Machine.
The number of new prospects created each day is a strong activity-based performance indicator. If outside sales reps aren’t hitting their numbers, it’s important to find out why.
Do they need additional training? Do they not have the right technology? Are they being lazy?
Sales managers should monitor and record prospecting activities in a transparent dashboard to keep reps accountable:
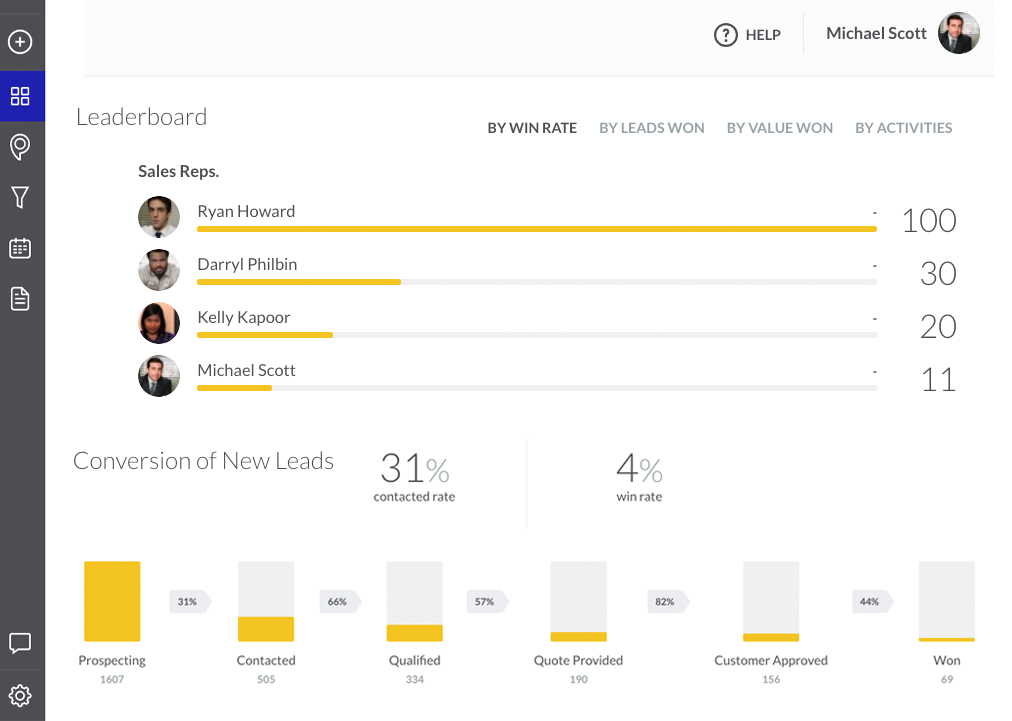
Image: SPOTIO Sales Leaderboard showing top-performing sales reps by activity count, leads won, win rate, and value of opportunities.
Number of Contacts
Today, there are many ways sales reps can communicate with leads — call, email, or converse via social media. Monitoring the number of contacts can help sales managers determine how proactive reps are in “working” new prospects. It can also help pinpoint which specific channels have the highest conversion rates.
Number of Visits
Prospects will not always respond to calls, emails, and social media outreach. Often, reps need to put boots on the ground and attempt to visit prospects on site, in person.
Each rep should attempt to visit unresponsive prospects in-person each day.
Each visit should be logged in your CRM.
Number of Follow Ups
80% of sales require five follow-up calls after the meeting. Yet, 44% of sales reps follow-up only once.
Just because an outside sales rep has a foot in the door doesn’t mean they will convert the lead or close the sale. Reps need to be following up with prospects multiple times after the initial meeting in order to keep the conversation moving along. After all, these are your warmest leads.
Monitor this metric to determine how many follow-ups it takes to re-engage a prospect. Set that number as your baseline for all reps to hit within a specific timeframe.
How to calculate:
Total (#) of Follow-up Attempts / Total (#) of Leads = Average (#) Follow-up Attempts Per Lead
Number of Referral Requests
Referrals are one of the highest-converting lead sources. Make sure sales reps are actively asking existing customers for new referrals as part of the daily sales process.
You could offer customers a discount or deal in exchange for a closed referral.
Lead Response Time
The first business that responds to a lead inquiry dramatically increases its chances of closing the deal. According to InsideSales, “50% of buyers choose the vendor that responds first.”
How long does it take your reps to follow up with a new lead?
Number of Upsells
Expansion revenue is critical for increasing Customer Lifetime Value. Since there are practically zero upsell costs, it can have a huge impact on profitability.
Reps should be actively looking for opportunities each day to upsell existing accounts.
|
Editor’s note: Looking to keep your field sales reps more accountable for their daily sales activities? Use a tool like SPOTIO’s rep tracking software to monitor activities and better plan sales territories: |
Weekly Sales Reports
Weekly sales reports should tell you how effective daily activities are in driving quality leads and opportunities into the pipeline.
Here are the metrics to include in your weekly sales activity report:
Number of New Leads
This metric determines how many new sales-qualified leads your reps are acquiring every week. Knowing this will help you determine if goals are being reached and whether you need to make adjustments.
For instance, if there’s a low number of new leads each week, it might be due to sales reps not contacting enough prospects, contacting the wrong type of prospects, or having poorly optimized outreach scripts.
Here’s a formula you can use to calculate new leads pre-qualified by reps each week:
# of new leads over 30 days / 4 weeks = # of new leads per week
Number of Meetings Booked
Getting lots of new leads each week is great. But sales reps also need to book meetings with those leads. Booking meetings is a clear indicator of new sales qualified opportunities.
Furthermore, calculating the number of booked meetings can help determine if your reps are able to communicate the value of your product or service.
You can use this number to determine, on average, how many leads are needed to generate a meeting (opportunity).
Use this formula to calculate weekly booked meetings:
# of meetings booked per week / # of new qualified leads = the percentage of leads that agree to meetings
First Meeting Show Rate
Are leads actually showing up to scheduled meetings? Some will be a no-show, so it’s important to track how often this occurs.
Determining your first meeting show rate will identify patterns or issues with your prospecting or sales tactics.
To calculate this metric, you can use the following formula:
# of leads that show up to meetings / # of meetings booked per week = percentage of prospects that show up to the first meeting
Lead-Opportunity Rate
It’s important to identify how many leads turn into sales qualified opportunities (i.e. how many leads moved forward with l meetings). Understanding this number will help you reverse-engineer the sales cycle.
For example, if you know the average lead-opportunity conversion rate, you can estimate how many new leads your sales team needs each week in order to hit a target number of new opportunities (meetings).
This intel is critical when it comes to setting sales activity targets for each rep.
To calculate this, you can use the following formula:
# opportunities / # leads * 100 = lead-opportunity rate per week
Number of Proposals Sent
Proposals sent is a metric that tracks the number of potential quotes and sales packages reps sent to customers after discovery calls, meetings, and demonstrations.
This is a strong leading indicator of how effective reps are at demonstrating value during sales presentations.
Monthly Sales Reports
Monthly reports should show how well the sales team is building the pipeline and converting it into net new revenue.
Number of Lost Deals
Your sales reps are getting leads, but how many are not closing? This metric can help pinpoint errors in the outside sales process. It can also indicate a flaw in the types of leads your marketing and salespeople are generating.
Number of Won Deals
You win some, you lose some. How many leads are your sales reps winning over? Knowing this number can help identify what’s working for your top sales reps. Use these insights to refine the sales process and train/onboard new team members.
Win Rates
Sales win rate is the percentage of deals that actually closed. This metric provides great insight into rep productivity and performance. If managers notice that a rep has a low win rate percentage, they should investigate further to see if it’s a result of poor rep application, or if additional training is required.
Sales win rates can also be segmented in two ways. First, you can look at the closed deals as a percentage of all sales opportunities. Or, you can look at the close rate across only the qualified sales opportunities. The latter can sometimes provide a more accurate gauge of rep efficiency since it isn’t skewed by unqualified opportunities.
Pipeline Value (by Stage)
The value at each stage in the pipeline can give a great top-level view of your financial health, and also help identify potential bottlenecks in the sales process.
For example:
Do you have a lot of potential revenue tied up at the meeting stage? Maybe you have a lot of revenue potential tied up in proposals?
These insights can help you direct resources to the weakest areas in your pipeline.
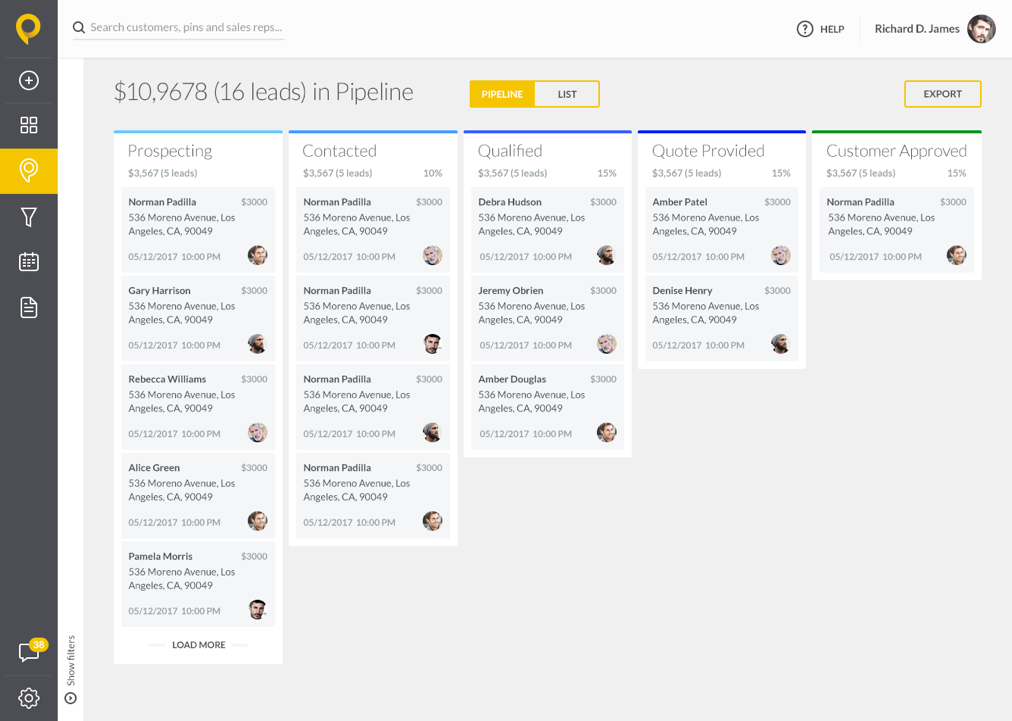
Image: SPOTIO pipeline visibility.
Close Rate
The average number of deals your reps close will identify whether your sales reps are winning more than they’re losing. If your close rate is low, then you can determine which reps are struggling to win deals and need further training or guidance.
The formula for this is:
# closed won deals / (# closed won deals + lost deals)
Average Deal Size
It’s important to know how much revenue the average deal brings in so that you can better allocate resources.
For example:
If 50% of your sales team is working to close enterprise accounts, but the average deal size is only $2,000, it would probably be a better use of resources to shift more reps onto smaller accounts.
Here’s a formula you can use:
Sum of the value of won deals/ # of won deals
Net New Revenue
This is both a directional and north star metric.
Sales teams need to be bringing in a specific amount of new revenue each month in order to hit annual quotas.
Failing to hit this number in a given month should prompt management to look closer outside sales reporting metrics to identify weaknesses in the sales process.
How to calculate it:
Gross revenue minus sales returns, allowances, and discounts
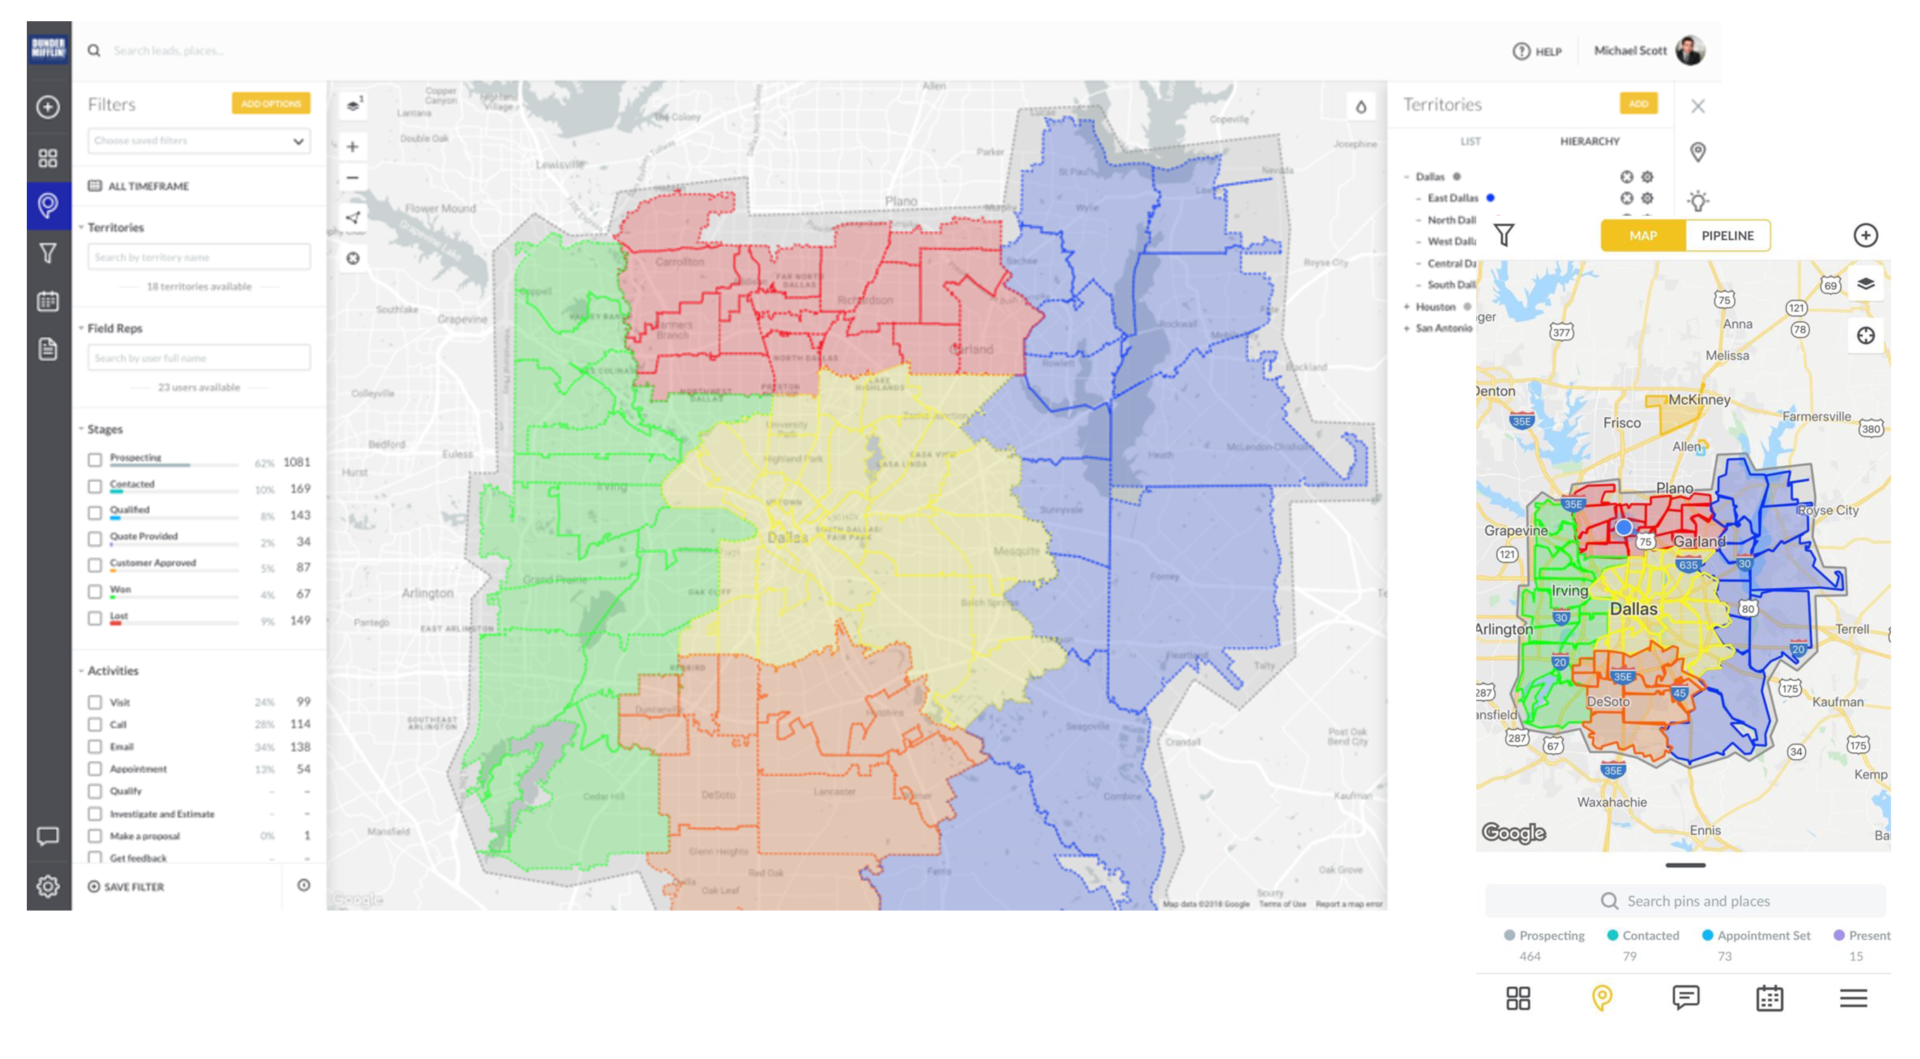
Revenue by Territory
This is an important metric to track because it tells you where your most receptive and valuable markets exist. This level of insight can help dictate where you assign top sales performers.
For example:
You could re-assign them to a high-value territory, or bring them in to train reps in underperforming territories.
| Editor’s note:
You can use a tool like SPOTIO’s Territory Manager to set goals, define territories, assign reps, and track revenue performance:
|
Monthly Percentage of Goal
Each year, the C-Suite comes up with annual revenue goals they’d like to reach. And it’s up to marketing and sales to achieve them. With this metric in your monthly sales activity report, you can track progress and forecast whether you’ll hit quota as time goes on.
Cumulative sales MTD (in dollars) / the monthly goal (in dollars) = percentage of goal
40 Experts Reveal What They Track in Daily, Weekly, and Monthly Sales Activity Reports

Nicole Suther
Daily: number of leads, number of opportunities, number of booked appointments.
Weekly: cost of acquisition, conversion of leads to opportunities.
Monthly: sales cycle length, revenue per deal, revenue per opportunity, closed lost/closed won deals.

Richard Harris

Mica Longanecker

Max Pittman

Aristide Basque

Bob Apollo
We believe that outcomes are far more important than raw activities. So – on a daily basis, we encourage our clients to monitor advances. An advance is typically represented by a prospective customer committing to or completing an action that represents tangible progress in the buying/selling process.
In addition, on a weekly basis, we encourage them to monitor the volume and value of opportunities that have moved from one stage to the next (including closed won), as well as the volume and value of new opportunities that have been added to the pipeline.
Then, on a monthly basis, we encourage them to aggregate their progress, assess trends, analyse the reasons behind positive and negative variations, and identify any necessary corrective actions.

Spencer Smith

Ben Walker

Jeni Wehrmeyer
Weekly: Key Target Conversations, Meetings, Opportunities and Sales
Monthly: Pipeline, Continuations, Sales and % of Goal

Kim Orlesky
Number of meetings booked (we can’t propose and close if we aren’t having any meetings)
Pipeline (How much in revenue are we working towards? Our goal is to have 4x the amount of actual revenue needed)

Sean Sheppard
- Number of Deals by Stage
- Conversion Rates by Stage
- Sales Velocity (Sales Cycle Time)

Srish Kumar Agrawal
Daily:
- #of meetings set by each Sales Rep.”
- Lead Response Time of each Sales Rep.
- # of Client Conversations by each Rep.
Weekly:
- # of Outbound Calls
- Rates of Up-Sell/Cross-Sell
- Revenue Generated by each Sales Rep.
Monthly:
- Source of Each New Opportunity that is Created
- Customer Acquisition Cost
- Lead Conversion Ratio

Chad Burmeister

Colleen Stanley

Seb Dean


David Jackson

Ian Evenstar
New opportunities & exploratory calls.
Website traffic by source.

Angela Ash

Andrea Loubier

Alexandra Zamolo

Greg Brookes

Carrie McKeegan


Jake Fisher
We keep a close eye on the total amount of estimated revenue and quantity of deals in the stages of the funnel before a proposal. This helps us identify issues early.
We also look at the close rate from proposal to closed won.
This helps us uncover potential issues in the exploratory phase.

Rob Bedell


Mike Brooks

Alex Birkett
For our agency, we actually keep it very simple. We’re a small operation and our business is mostly built on referrals, but for outbound sales, we look at these metrics:
- Monthly recurring revenue
- Net new revenue (monthly)
- Net new clients closed (monthly)
- Meetings booked, proposals sent, outreach emails sent, and response rates
We could probably optimize some of our outbound, but honestly, we’re mainly focused on referrals and inbound for now.

Maddy Osman

Lisamarie Monaco


Alice Kemper
The key metrics we monitor are Client Engagement, Retention, and Upsell. If we’re not talking and connecting with our current and future clients… someone else certainly is.
When we’re good at Client Engagement, Retention is high and client turnover is low. We want to retain our current clients because it’s an indicator we are achieving our purpose goal to be a valuable resource to businesses assisting with their success. Little to no turn-over also means we are in continuous growth mode and not catch-up and maintenance mode. Plus, we know our customers will be a prime referral funnel.
Upsell… well we know our best customers are our current happy customers who want more of what we offer as their trusted advisor and their strategic business partner. This also keeps us fresh to continue to create and serve the ever-changing needs of the marketplace.

KRISTIE JONES

Damian Thompson

Rene Grajales
- Number of buying customers
- New logos acquired
- Revenue generated by role

Chris Gadek
- Local Sales – to monitor the impact that our company is having on our local area, so that we can see how to better utilize our local keywords for SEO.
- National and International Sales – this metric will allow us to see how well we are performing in different regions, so that we can pivot and make quick changes when needed.
- Individual Sales Stats – understanding which members of our sales team are performing better is important, so that we can offer assistance and additional resources to help those who may require it.
Simplify Sales Activity Tracking and Reporting
Sales activity tracking and reporting is critical to improving rep productivity and performance. But, how do managers properly track key metrics across multiple channels, and present it in a format that is easy for sales leaders and executives to digest?
Our suggestion: use SPOTIO’s new “My Reports” feature.
My Reports makes it quick and easy for field sales managers to create custom reports inside their SPOTIO accounts, including only the activity metrics and KPIs that are most important to their business.
Request a free demo of SPOTIO today to see My Reports in action.