You’re a field sales manager, which means you spend a lot of time crafting sales reports—or, at least, you should. If you’re like most, though, you hate this part of your job.
We want to help! In this article, we’ll explain what a sales report is, the 10 sales reports you should run for your field sales team, how to craft a dynamite report, a specific tool you can use to report on sales faster than ever before, and more.
We have a lot of information to share. Time to get this show on the road!
What is a sales analysis report?
A sales report, sometimes referred to as a “sales analysis report,” is a document that tracks specific sales activities and their results over time.
Every sales report is different. That said, most contain information about leads, new accounts won, and revenue generated. Sales leaders and other management professionals can use this information to evaluate sales performance.
The truth is, a proper sales performance report may be the difference between success and failure for your department.
Why? Because this kind of tool will help you determine which sales strategies work best for your sales team. You can then double down on winning tactics, while removing ones that don’t produce favorable results for your company.
10 important reports for field sales teams
There are many different kinds of sales management reports. Here are ten that your field sales team should be running on a regular basis.
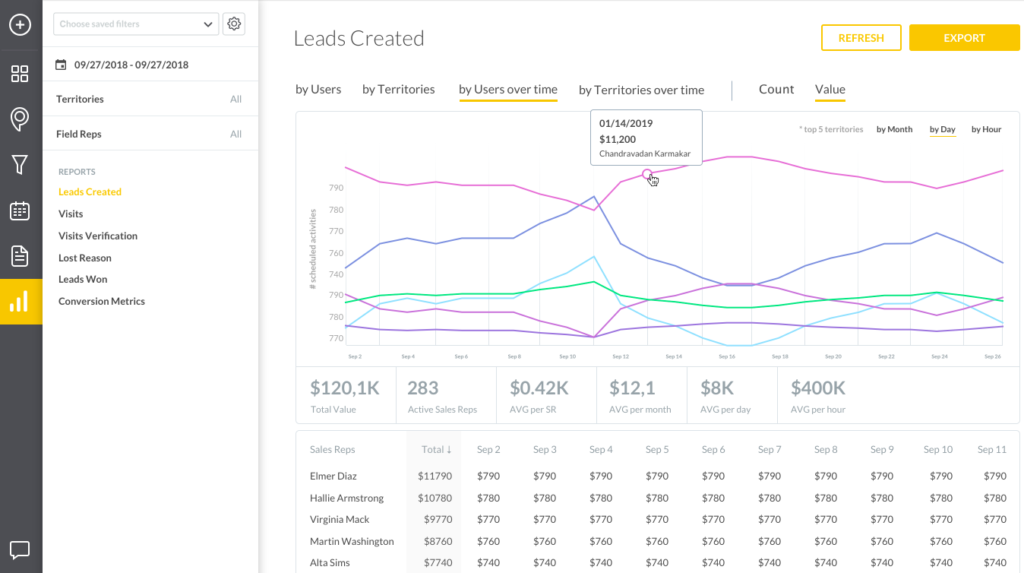
Sales activity report
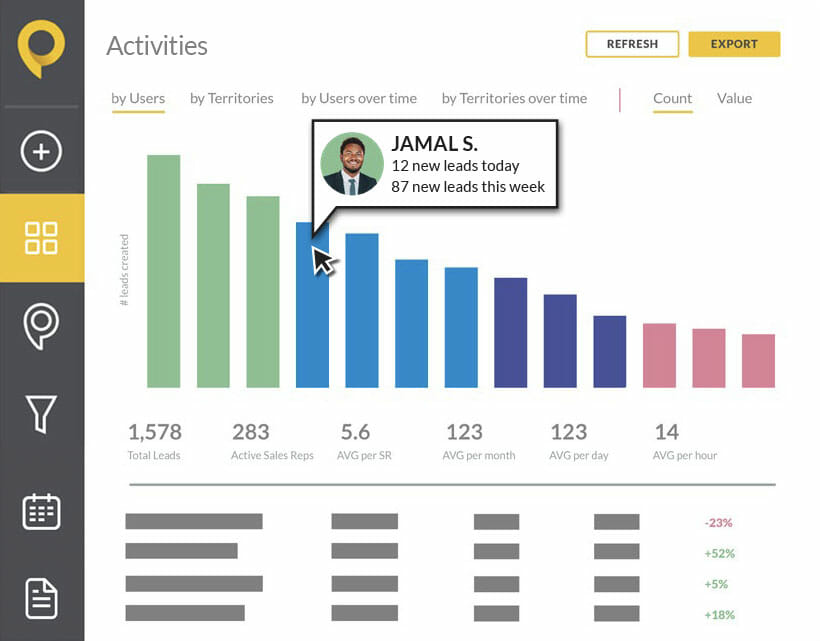
True to its name, the sales activity report tracks the various sales activities that sales reps perform on a daily, weekly, monthly, and even annual basis. With this information, you’ll learn why your reps achieve the results they do.
Why this report is important: Sales activity reports are all about effort. Are your reps making enough visits and calls? Do they send enough emails and texts? Are they updating your CRM software of choice to make future sales easier?
If the answer to these questions is “no” then you need to motivate your reps to work harder. If the answer is “yes,” invest in better training to improve results.
Sales pipeline report
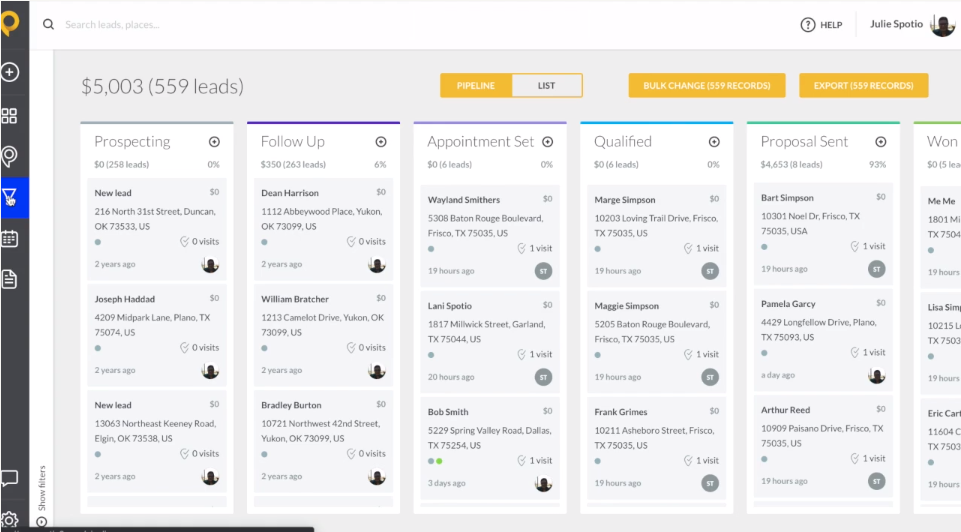
The sales pipeline report is a visual representation of your sales process, depicting important information like the number of leads, opportunities, and deals your reps have won. These details make it easy to adjust sales strategies when needed.
Why this report is important: This report will help you gauge the overall health of your department. Healthy sales teams generate plenty of leads, opportunities, and deals. Unhealthy sales teams do not.
We recommend analyzing conversion metrics at every stage of your sales funnel. Doing so will help you pinpoint potential problems.
If, for example, your reps produce a ton of leads, but few opportunities, you probably need to reconsider your target audience. You may be going after the wrong people, which is why your lead-to-opportunity ratio is subpar.
Total sales performance report
A total sales performance report will tell you (surprise!) about the total number of sales your team has generated within a specific time period, i.e. one month.
Why this report is important: Are you bringing in enough sales? Take a look at your total sales performance report to see. Your answer will determine your actions.
If you need to produce more sales, for instance, you probably need to invest in new sales strategies and tactics. The ones you’ve deployed in the past aren’t working. If, on the other hand, you’re happy with your sales numbers, keep the status quo.
Win-loss analysis reports
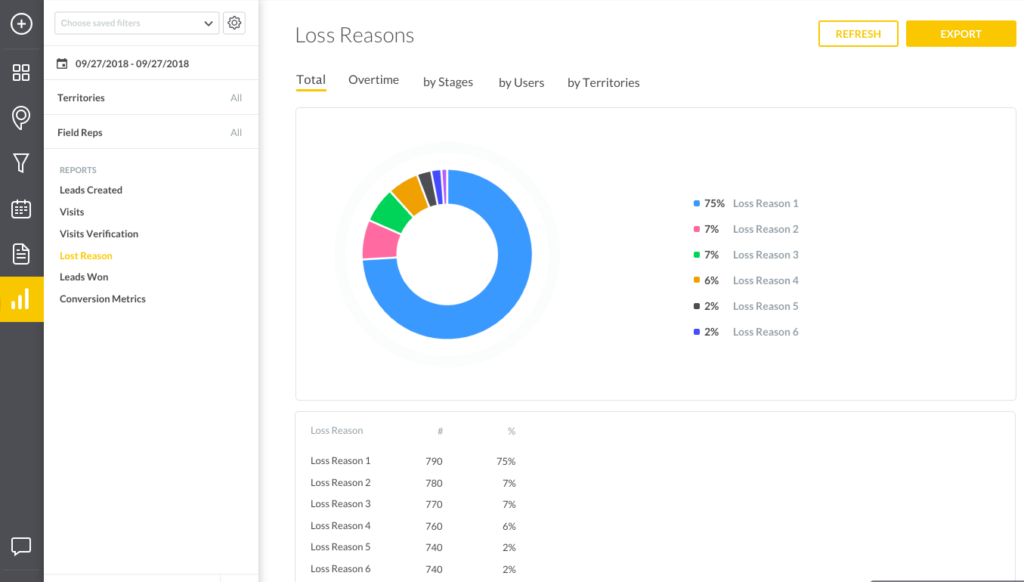
The win-loss analysis report will show you how many sales opportunities your reps turned into actual sales for your company. Hopefully, your win-rate is sky high!
Why this report is important: Win-loss reports analyze the effectiveness of sales tactics. If the call and meeting scripts, email templates, etc. that your reps use are working, you should have a favorable win-rate. If they aren’t, well…
Take an honest look at your win-loss report. If you like what you see, double down on your current tactics. If you need to see better results, try different approaches.
Average deal size report
The average deal size report tracks the revenue your company generates per sale. For some sales departments it will be $10. For others, $10k. It really just depends.
Why this report is important: When you know how much each deal is worth to your company, you’ll know how many deals your reps need to close to hit your revenue targets. You can then set appropriate sales goals for your team.
If, for instance, your team’s average deal size is $10,000 and you want to generate $100,000 of revenue in the next 30 days, you know you need to close 10 deals.
Revenue by sales reps report
The revenue by sales rep report makes it easy to see the amount of revenue that each of your reps generates for your sales department.
Why this report is important: This report will tell you who your best sellers are. Armed with this information, you can assign the right leads to the right reps at the right times, generating more revenue in the process.
Let’s say that your company just landed a meeting with a top prospect—one you’ve been trying to get in touch with for months. Are you going to assign that lead to the guy you just hired or your star rep who’s most likely to close the deal? Exactly.
Revenue by territory report
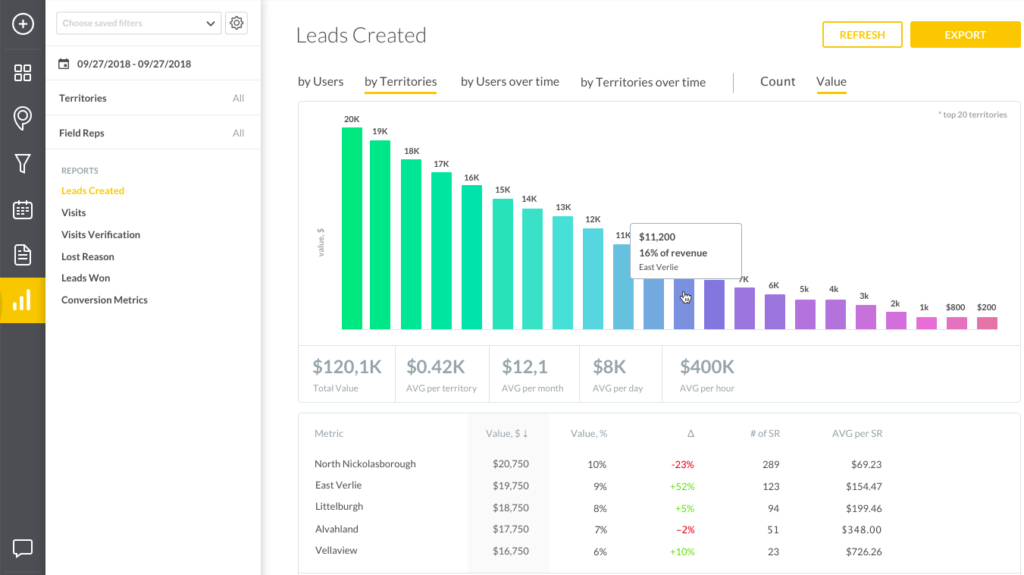
The revenue by territory report is similar to the revenue by sales rep report we just discussed. The difference? Revenue by territory reports track territory performance, rather than individual sales rep performance, which is important because….
Why this report is important: When you know how much revenue a specific territory generates, you can make smarter sales decisions.
If, for example, you run this report and see that a specific territory is producing a ton of sales, you can assign multiple reps to it. Doing so will allow your company to cover more ground and (hopefully!) generate more sales in less time.
Upsell and cross-sell reports
Upsell and cross sell reports track two things: the number of upsells and cross sells that your reps have made, and the value of each transaction.
Why this report is important: Access to the upsell and cross sell information in these reports is critical. With it, you can pinpoint the best upsell and cross sell opportunities and train your reps to identify and take advantage of them.
You’ll also be able to determine which products and/or services are easiest to upsell and/or cross sell. Once you share these details with your reps, revenue will rise.
Sales leaderboards
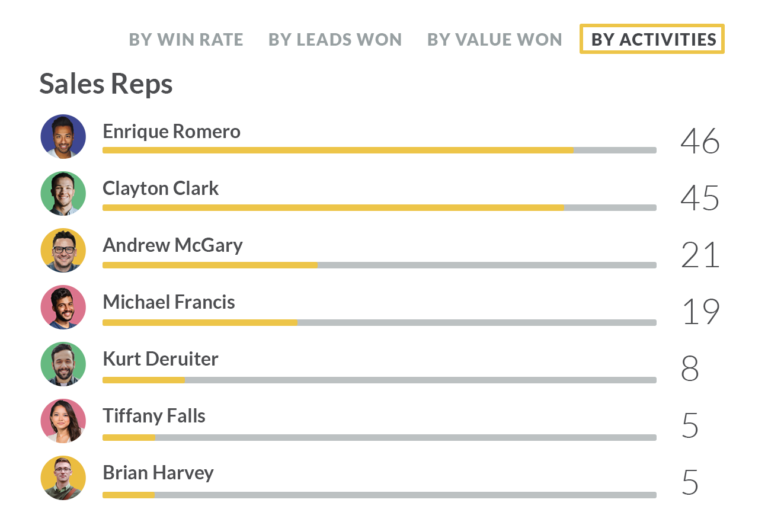
A sales leaderboard report will track the performance of every rep in your department, then rank them from first to last on a virtual scoreboard.
Why this report is important: While not a traditional field sales report, leaderboards can be extremely useful. Sales managers can use them to stimulate friendly competition and motivate their reps to work harder and achieve more.
Running leaderboard reports on a regular basis will also tell you which of your reps are driven, ambitious professionals and which aren’t.
Sales forecast reports
Sales forecast reports use current sales data to predict future results. Want to know how many deals you’re likely to close next quarter? Run one of these reports ASAP.
Why this report is important: If you know that your field sales team will probably close 10 deals next month, resulting in $50,000 in revenue, you can:
- Plan Ahead: Knowing how much money your department will generate is vital information, which company leaders can use to make better decisions.
- Make Adjustments: What if you need to make more than $50k in revenue next month? You can adjust your sales strategy to try and close more deals.
Daily, weekly, monthly and annual sales reports
The report you want to run, as well as the information you want to reveal, will help you determine the time frame that your reporting efforts cover.
Let’s dive into that a bit more…
Daily: Daily sales reports are great for granular information, like the number of visits a rep makes on a daily basis and the number of leads said visits produce.
Weekly: Weekly sales reports are best for tracking team-oriented goals, like the number of deals closed and revenue generated by an entire sales department.
Monthly: Monthly sales reporting gives sales managers a birds-eye view of the metrics in daily and weekly sales reports, providing a longer-term perspective.
Annual: Finally, annual sales reports are big-picture tools. They can be used to plan sales quotas for each of your reps, identify sales trends, pinpoint Marketing’s impact on your department, and otherwise help you become a better manager.
PRO TIP: If you can set up some of these reports to run and send to stakeholders automatically (especially the daily and weekly ones) that will save you a lot of time down the road. Depending on the system you use, this may or may not take a lot of time to accomplish, but it’s well worth the effort.
How to make a sales report
We’ve covered the different sales reports that you can run for your field sales team. Now, let’s talk about how to write a sales report in the most effective way.
Here are a few tips to make sure your sales reports add value to your company.
Identify your audience
The person you plan to give your sales report to will largely determine the information your report includes. Reports for sales reps will contain information specific to each rep’s performance. Reports for executives should summarize your entire team’s performance in a succinct and easy-to-understand way. Identify your audience and keep them in mind when crafting your sales reports.
Start with the end goal in mind
What message do you want to convey with your sales report? When you know the answer to this question, you can include KPIs and metrics that support your goal. If, for example, you want to show upper management that you’ve increased sales by 10% this quarter, you can highlight team figures related to close rate and revenue. Always start with your goal so that you end up where you want to be.
Choose the desired reporting cadence
As described above, daily, weekly, monthly, and annual sales reports can be used to more accurately convey specific bits of information. Now that you know who your audience is and the data you want to share with them, choose a reporting cadence that fits. Then compare your most current metrics to the same metrics of the previous year (i.e. August 2022 to August 2021) in your report. Like we mentioned earlier, if it’s possible to set some of these reports to run and send out automatically, we highly recommend doing so. It may require a bit more effort up front, but the time you’ll save in the future will be monumental.
Select only the most relevant KPIs
You don’t want to overload people with information. Give them the most relevant data, then cut the rest. How do you know which KPIs are relevant and which aren’t? This is why you start with the end in mind. The goal of your sales reporting efforts will determine relevance. Scan through your sales data and find the KPIs and metrics that matter to your audience and support your narrative.
Visualize sales data points
Now that you’ve collected your sales data, do your best to visualize it. Doing so will make your sales reports much easier to understand. This is especially important when reporting to executives and other people who aren’t in sales. They probably don’t understand what all of your metrics mean. They don’t have time to learn either. Add graphs, charts, etc. to make your reports easy to digest.
Provide an analysis of the data
Finally, tell your audience what the numbers mean—especially if the numbers tell a less-than-awesome story. Maybe sales declined last quarter. A graph that shows negative growth is generally cause for concern. But what if sales declined because of supply chain issues, not because of poor performance? Making this clear in your reports is important. Always give your reports context by providing data analysis.
Reports on only the metrics that matter most
As a sales manager, you need sales reports.
Yes, crafting them can be a pain. But sales reports are essential tools that will help you gauge the health of your department, plan better sales strategies, and communicate with company leadership in more meaningful ways.
Looking for the easiest, best way to create sales performance reports for your company? Give SPOTIO a try. Our My Reports feature makes it easy to craft reports in seconds, using only the data that matter to you and/or your audience.
Sign up for a free demo to see SPOTIO in action and decide if it’s right for you.