To coincide with the 17th G20 Heads of State and Government Summit taking place in Bali, Clarivate has released its Annual G20 Scorecard – Research Performance 2022.
This annual review of research indicators for the G20 members by the Institute for Scientific Information (ISI)™ at Clarivate™ enables policymakers and research leaders to identify trends and benchmark key indicators across regions.
The scorecard includes a profile for each G20 member, highlighting its research spending, researcher demographics and publishing activity based on the Web of Science Core Collection™, a global citation index of 21,000 journals from all academic disciplines.
Summaries for each G20 member are available in the report. Here are a few highlights:
- Brazil: While open access output remains strong across many disciplines, the overall proportion has dropped below the G20 average in 2021. The largest share of output is in life sciences (37%); however, the proportion of open access in this discipline has fallen from 47% to 37% over the decade, primarily due to a fall in domestic open access. Impact and collaborative impact are both below the world average.
- Mainland China: Output has tripled in a decade, with more than a third of a million papers published in the mathematical and physical sciences (including chemistry and materials science) in 2021 alone. Impact is above the world and G20 averages. Much of this output, however, is domestic; consistently only a quarter is internationally collaborative. While GDP has increased by 60% between 2012 and 2020, GERD has doubled in the same period, leading to an increase by a quarter in GERD by GDP.
- Saudi Arabia: More than four-fifths of all output is now internationally collaborative, with the total output having more than doubled between 2018 and 2021. This leads to an impact well above world average. If the collaboration class is considered, however, impact is around the world average. Open access output is strong in most fields and generally tracks just above the G20 average.
- United States: At 1.18, collaborative impact is highest among the G20, although other regions have a higher CNCI. Like the United Kingdom, and in contrast to most other regions, domestic collaborative impact is higher than that for international output. Productivity as indexed output per GERD is well below the G20 average and falling, however, and open access is also weak, except in the hard sciences. The largest share of output is in medicine, in contrast to all other G20 members where the mathematical and physical sciences have the greatest share.
Insights about the other G20 members can be found in the full report.
New to this year’s report is the Collaboration-CNCI (Collab-CNCI) indicator, a new way of assigning author credit from the Institute for Scientific Information. The traditional Category Normalized Citation Impact (CNCI) indicator normalizes citation impact for the category of research, as well as the year of publication and document type. Collab-CNCI also normalizes by collaboration type.
There are five possible collaboration types, based on the author affiliation data in the Web of Science™: domestic single institution, domestic multi-institution, international bilateral, international trilateral and international quadrilateral plus. This enables fair comparison of similar papers, e.g. only papers with international bilateral collaboration. This enables a more nuanced assessment of impact.
For more details on Collab-CNCI, see Making it count: Research credit management in a collaborative world.
Here is one example of Collab-CNCI for Mainland China from the report.
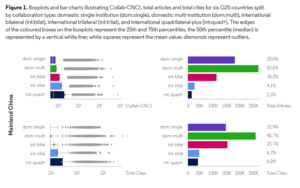
Source: Annual G20 Scorecard – Research Performance 2022
This shows that Mainland China has a higher percentage of domestic papers than most other G20 members. As its level of international collaboration increases, the level of citation impact likewise increases. In contrast, the report shows that other G20 members, like Saudi Arabia and the United Kingdom, have a high percentage of internationally collaborated papers.
The profiles for each region contain a variety of visualizations. Following is an example of an impact profile for Australia. This visualization displays the distribution of CNCI values for a 10-year period, with lines for all Australian papers, domestic and internationally collaborated papers, and the G20 entire dataset as a comparison. The shows that Australia tends to outperform G20 as a whole and it has more internationally collaborated papers at the highest levels of citation when compared to other types.
Figure 2: Impact profile for Australia; Web of Science Core Collection
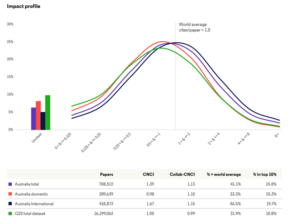
Source: Annual G20 Scorecard – Research Performance 2022
Trends in open access publishing are also highlighted. The open access status is derived from the Web of Science Core Collection. This example of Indonesia Open Access publishing shows its domestic papers (orange) and total papers (purple) have reached around 50% open access in 2021. The green line represented the G20 group, which also shows a steady increase toward more open access articles. When looking at disciplines, Indonesia publishes more open access in Medicine (Med) and subjects allied to medicine (SAM) than in Arts & Design (A&D).
Figure 3: Open access publishing for Indonesia; Web of Science Core Collection
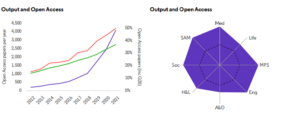
Source: Annual G20 Scorecard – Research Performance 2022
As leaders of the G20 members come together to discuss the world’s most pressing challenges, this scorecard of research activity can help inform their policy decisions. As topics of global health, energy supply, food access and climate policy are discussed, the state of each region’s scientific research should play a central role.
Read more of our ISI Global Research Reports, or get in touch to talk to us about your research analytics, evaluation and management needs.