Evaluating NMR relaxometry for antibody identification
Posted: 25 September 2023 | Gregory Webster PhD (AbbVie) | No comments yet
NMR relaxometry is a promising technique for identifying pharmaceutical raw materials without the need for laboratory testing. Gregory Webster, Senior Principal Research Scientist at AbbVie, considers the use of NMR relaxometry for identity confirmation of monoclonal antibodies.

Nuclear magnetic resonance (NMR) relaxation techniques traditionally used in the food and chemical industries are becoming more relevant to pharmaceutical applications as well. The measured relaxation rate constants resulting from fast chemical exchange between water and exposed NH and OH protons on proteins can be selective to biologics. This has led to applications with biopharmaceutical formulations and protein investigations. Of particular interest is the potential of using NMR relaxometry as a point of receipt technique to satisfy regulatory identity testing requirements for active pharmaceutical ingredients (API) and drug product materials.
Identity testing of raw materials under GMP
Good manufacturing practices (GMP) require that materials received for manufacture be tested to confirm identity (eg, 21 CFR 211.84, EU GMP Annex 8). Failure to do so has resulted in several warning letters to manufactures.1 In terms of efficiency, the ability to execute identification testing at point of receipt in the warehouse is preferred to the traditional approach of (i) sampling the material received, (ii) sending the samples to the lab for testing and (iii) quarantining the material until laboratory confirmation is received.
NMR relaxation methods distinguish between components (phases or compounds) that have different molecular mobilities
For monoclonal antibodies, identification methodologies can employ chromatography, spectroscopy, isoelectric focusing, capillary electrophoresis and peptide mapping techniques.2-7 Resolving closely related antibodies can be challenging for chromatographic, electrophoretic and spectroscopic techniques. This has led to peptide mapping becoming the primary method for identity testing with these molecules.4 However, peptide mapping is an intensive technique requiring sample digestion, which comes at a high cost and incurs delays waiting for results.
The demand to reduce costs has led to the use of handheld instrumentation, such as Raman spectrometry, to eliminate sending receipt samples to the laboratory. This has significant cost savings.8,9 While Raman and infrared spectroscopies have been used to fingerprint biologicals, the spectral interpretation of these large molecules is naturally more difficult than with small-molecule pharmaceuticals and solvents.10 Our laboratory is interested in developing identity testing that is rapid and selective as demonstrated by Raman handheld instrumentation but with simple interpretation for proteins. The ultimate goal is use of the technique at the point of receipt and not requiring samples to be sent to quality laboratories for identity testing.11
How does NMR relaxometry work?
NMR relaxation methods distinguish between components (phases or compounds) that have different molecular mobilities. The relaxation time constants (T1 and T2) are physical properties of the sample and are sensitive, eg, to molecular mass, viscosity of a liquid sample or rigidity of a solid sample. The longitudinal relaxation time constant (T1) is the rate at which excited protons realign with the external magnetic field. The transverse relaxation time is a measure of the time taken for spinning protons to lose phase coherence among the nuclei spinning perpendicular to the main field.
While TD-NMR measures the rate constants in the time domain,12,13 and benchtop NMR experiments are Fourier transform based,14 both instrumentation designs constitute “NMR relaxometry.” While TD-NMR has been used in the chemical and food industry for some time, its application to pharmaceuticals studies is more recent.
The NMR relaxation rate constants for water are affected by the presence of proteins.15 The influence of the protein analyte is based not only on its concentration and structure, but its size, hydrophilicity and tendency to aggregate in aqueous solvents. These interactions are selective enough for NMR relaxometry to fingerprint differences in detecting counterfeit sources,13 study protein agglomeration,16,17 polymorphs,18 drug delivery,19 disease diagnosis,20 and moisture content of lyophilised formulations.21
Identification testing using NMR relaxometry
Because NMR relaxometry meets the above criteria as a technique that can potentially be used at point of receipt without requiring samples to be sent to quality laboratories for identity testing, the technique was evaluated for its use in identity confirmation of antibodies.22
The results of that investigation are reproduced in Figure 1.
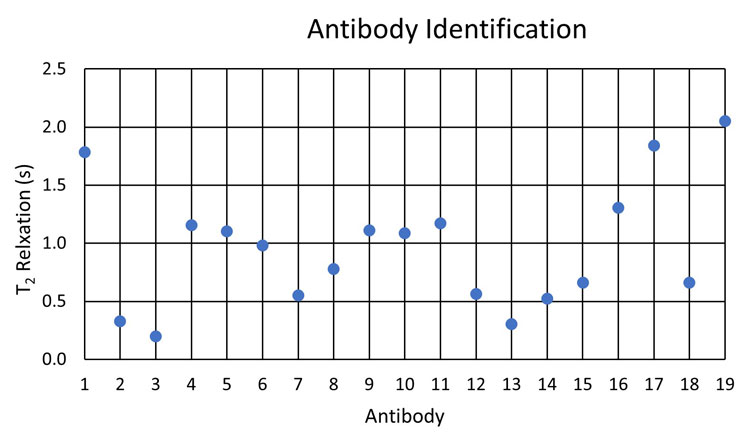
Figure 1: T2 response of representative antibodies. (Reproduced from Reference 22.)
This preliminary investigation using NMR relaxometry for antibody identification demonstrated differing T2 responses for the sample set under investigation. However, owing to the closeness of several responses, the selectivity for the representative set had to also incorporate the variability of response expected from manufacturing differing lots of materials. Subsequently, our laboratory determined that the relative standard deviation of the NMR relaxometry analysis with several lots of a representative pharmaceutical antibody was 0.66 percent. Applying this variability to data extracted from Figure 1, this representative variability is illustrated as error bars in a subset of antibody responses in Figure 2.
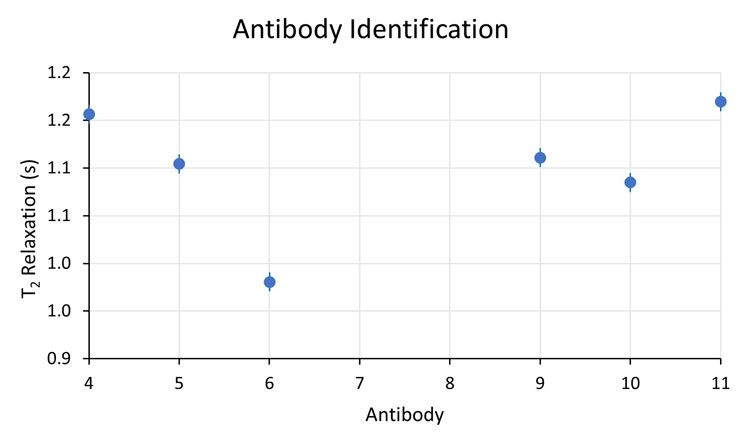
Figure 2: Enlarged scale of T2 response.
Under these conditions, antibody 5 cannot be resolved from antibodies 9 and 10; however, antibodies 9 and 10 are resolved from each other. Applying this representative variability to the rest of the Figure 1 dataset, we also conclude that antibody pairs 4 and 11, 7 and 12, and 15 and 18 are not resolved from each other. All other combinations are resolved.
Depending on the dataset and lot variability, the NMR relaxation technique has potential to be used with point-of-receipt identity confirmation, whether through comparison to a library set of rate constants or via a point-to-point sensor for shipping confirmation/data logging.
Quantitative analysis
The T2 rate constant decreases with increasing concentration due to more analyte interacting with the solvent as well as an increased amount of aggregation and viscosity to promote T2 relaxation. This negative correlation can provide a quantitative measure for the experiment.13 However, such studies require controlled matrices and might require multivariate analysis as well.23
Moving forward
Not all rapid identity determination is universal; however, NMR relaxometry looks promising having resolved the majority of the antibodies investigated, warranting further investigation and development. Resolution will have to be determined for each set investigated, as well as the variability of the materials.
For the NMR relaxation technique to be used with point-of-receipt testing, further development of instrumentation is needed for GMP and electronic records compliance. Fortunately, these capabilities are in development with several manufacturers. With meeting pharmaceutical regulatory requirements, NMR relaxometry has an exciting future as another solution for supply chain testing and protein research.
About the author
 Gregory Webster, PhD is a Senior Principal Research Scientist in Analytical Research and Development at AbbVie in North Chicago, Illinois, US. He obtained his BS in Chemistry from St Xavier College, MS in Analytical Chemistry from Governors State University and a PhD in Analytical Chemistry from Northern Illinois University. Gregory’s industrial career spans an employment history with several major pharmaceutical companies. His varied research interests have led to numerous peer reviewed publications and developing three books: Supercritical Fluid Chromatography: Advances and Applications in Pharmaceutical Analysis; Poorly Soluble Drugs: Dissolution and Drug Release; and Chromatographic Methods.
References
- Component Testing Gains Prominence in Drug Product GMP Warning Letters as FDA Focus Intensifies on OTC Topicals and Upstream Supply Chain [Internet]. IPQ International Pharmaceutical Quality. 2021. [Cited 2023Feb]. Available from: https://ipq.org/component-testing-gains-prominence-in-2012-2014-drug-product-gmp-warning-letters-as-fda-focus-intensifies-on-otc-topicals-and-upstream-supply-chain/.
- Egelhofer V, Gobom J, Seitz H, et al. P. Protein identification by MALDI-TOF-MS peptide mapping: a new strategy. Anal Chem. 2002; 74(8): 1760–71.
- Meert C, Guo A, Novick S, et al. M. Evaluation of pi marker sources for CIEF characterization of a therapeutic antibody. Chromatographia. 2007; 66(11-12): 963–8.
- Flatman S, Alam I, Gerard J, Mussa N. Process analytics for purification of monoclonal antibodies. J Chromatogr B Biomed Appl. 2007; 848(1): 79–87.
- Abbas SA, Gaspar G, Sharma VK, et al. Application of
second-derivative fluorescence spectroscopy to monitor subtle changes in a monoclonal antibody structure. J Pharm Sci. 2013; 102(1): 52–61. - Kubota K, Kobayashi N, Yabuta M, et al. Validation of capillary zone electrophoretic method for evaluating monoclonal antibodies and antibody-drug conjugates. Chromatography. 2016; 37(3): 117–24.
- Jaccoulet E, Boccard J, Taverna M, et al. High-throughput identification of monoclonal antibodies after compounding by UV spectroscopy coupled to chemometrics analysis. Anal Bioanal Chem. 2016; 408(21): 5915–24.
- Prullière F., Presly O. Identifying Raw Materials Inside Containers Using a Handheld Raman Spectrometer [Internet]. Agilent Technologies. 2020. [Cited 2023Feb]. Available from: https://www.agilent.com/cs/library/whitepaper/public/whitepaper_pharma_materials_ID_raman_vaya_5994-2091en_agilent.pdf.
- Bakeev K.A. “Using Handheld Raman Spectroscopy to Reduce Risks in Materials Used for Manufacturing,” Pharm. Eng., 2015; 35(3): 77-79.
- Kengne-Momo RP, Daniel P, Lagarde F, et al. Protein interactions investigated by the Raman spectroscopy for Biosensor applications. Int J Spectrosc. 2012; 2012: 1–7.
- Üstün B. Raw Material Identity Verification in the pharmaceutical industry [Internet]. European Pharmaceutical Review. 2018. [Cited 2023Feb]. Available from: https://www.europeanpharmaceuticalreview.com/article/19378/raw-material-identity-verification-in-the-pharmaceutical-industry/.
- Robinson MD, Cistola DP. Nanofluidity of fatty acid hydrocarbon chains as monitored by benchtop time-domain nuclear magnetic resonance. Biochemistry. 2014; 53(48): 7515–22.
- Akhunzada Z, Wu Y, Haby T, et al. D. Analysis of biopharmaceutical formulations by Time Domain Nuclear Magnetic Resonance (TD-NMR) spectroscopy: A potential method for detection of counterfeit biologic pharmaceuticals. J Pharm Sci. 2021; 110(7): 2765–70.
- Bouillaud D, Farjon J, Gonçalves O, Giraudeau P. Benchtop NMR for the monitoring of Bioprocesses. Magn Reson Chem. 2019; 57(10): 794–804.
- Hills BP, Takacs SF, Belton PS. The effects of proteins on the proton N.M.R. transverse relaxation time of water. Mol Phys. 1989; 67(4): 919–37.
- Taraban MB, DePaz RA, Lobo B, Yu YB. Use of Water Proton NMR to Characterize Protein Aggregates: Gauging the Response and Sensitivity. Anal. Chem. 2019; 91(6), 4107-4115.
- Indrawati L, Stroshine RL, Narsimhan G. Low-field NMR: A tool for studying protein aggregation. J. Pharm. Sci. 2007; 87(12): 2207–16.
- Stueber D, Jehle S. Quantitative Component Analysis of Solid Mixtures by Analyzing Time Domain 1H and 19F T1 Saturation Recovery Curves (qSRC), J. of Pharm Sci, 2017; 106(7), 1828-1838.
- Metz H, Mäder K. Benchtop-NMR and MRI—a new analytical tool in Drug Delivery Research. Int J Pharm. 2008; 364(2): 170–5.
- Masiewicz E, Ashcroft GP, Boddie D, et al. SR. Towards applying NMR relaxometry as a diagnostic tool for bone and soft tissue sarcomas: A pilot study. Scientific Reports. 2020; 10(1).
- Abraham A, Elkassabany O, Krause ME, Ott A. A nondestructive and noninvasive method to determine water content in lyophilized proteins using low-field time-domain NMR. Magn Reson Chem. 2019; 57(10): 873–7.
- Semones M, Bernstein J, La Colla M, et al. Portable Time‑Domain NMR: A rapid method for detecting changes in complex pharmaceutical materials and formulations. Pittsburgh Conference. 2022.
- Engelsen SB, van den Berg FWJ. Quantitative Analysis of Time Domain NMR Relaxation Data. in: Modern Magnetic Resonance. Webb G. (eds), 2017 Springer, Cham. 1-19.